Life Support System presents a dynamic and interactive model of the three global systems that support life on earth.
It has been suggested that there are three systems that control how our world operates and therefore determine the ultimate sustainability of all life. These are the human, natural and economic systems. The traditional view is that the economic system serves the human system; however there is increasing evidence that it has become separate as its guiding principles appear to have little to do with human or social needs. This idea of the three systems is sometimes called the “people, planet, profit” concept.
How can we show the relationship between these systems?
One approach is the Venn diagram which uses circles to represent the systems. The amount that the circles overlap indicates how much the systems influence or depend on each other. In the Venn diagram below, for example, systems A and B have some dependence on each other, but both systems are controlled by system C.
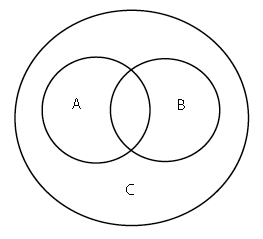
Shown below are four of many possible ways to model three systems using a Venn diagram. Model 1 shows a mutual interdependence between the systems, whereas model 2 shows no dependence at all.
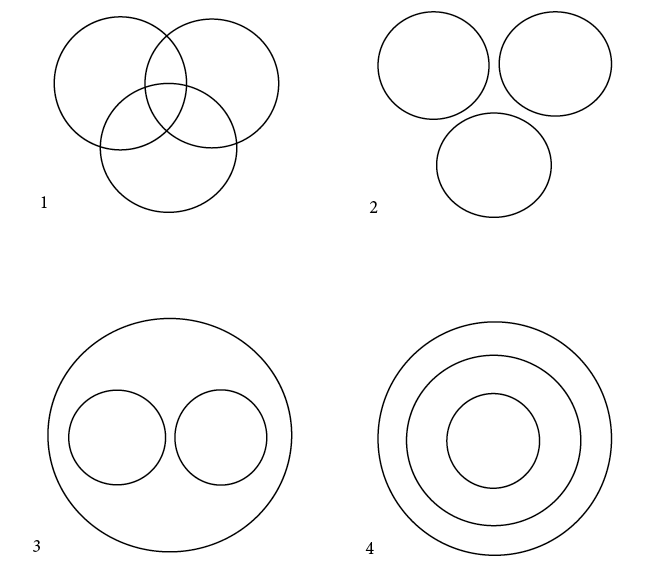
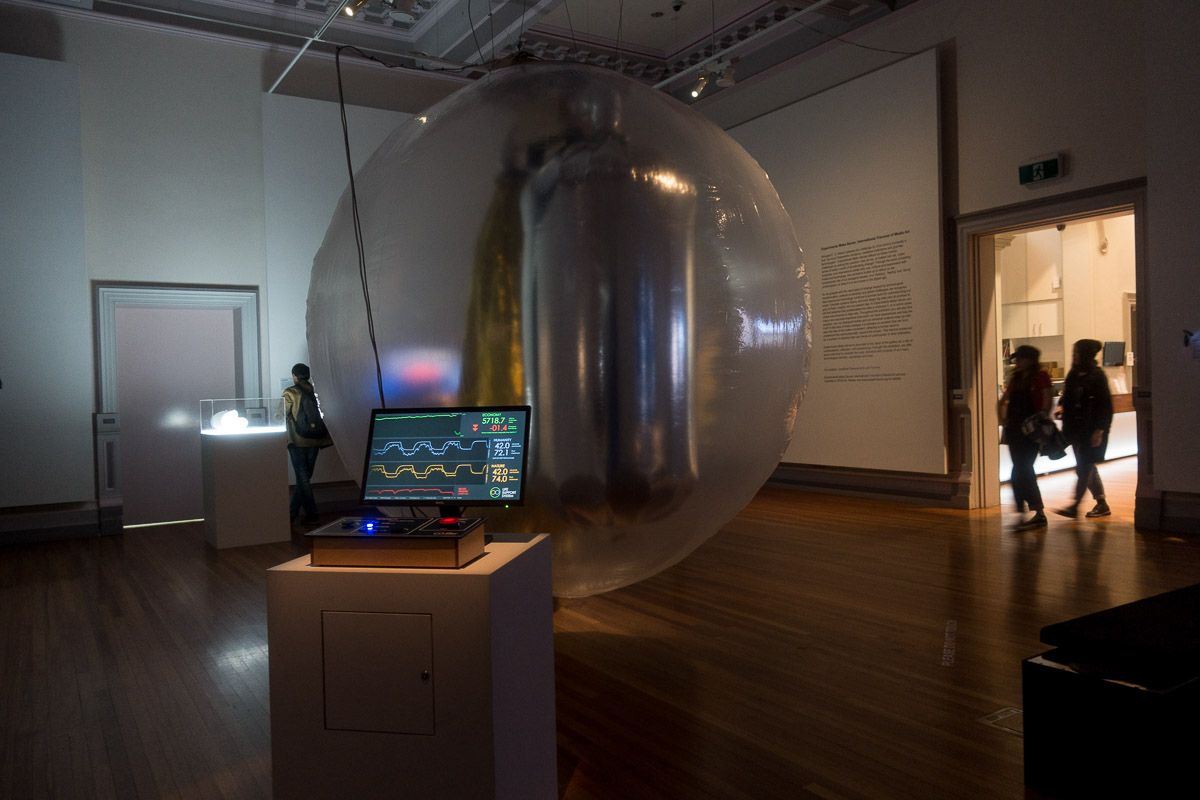
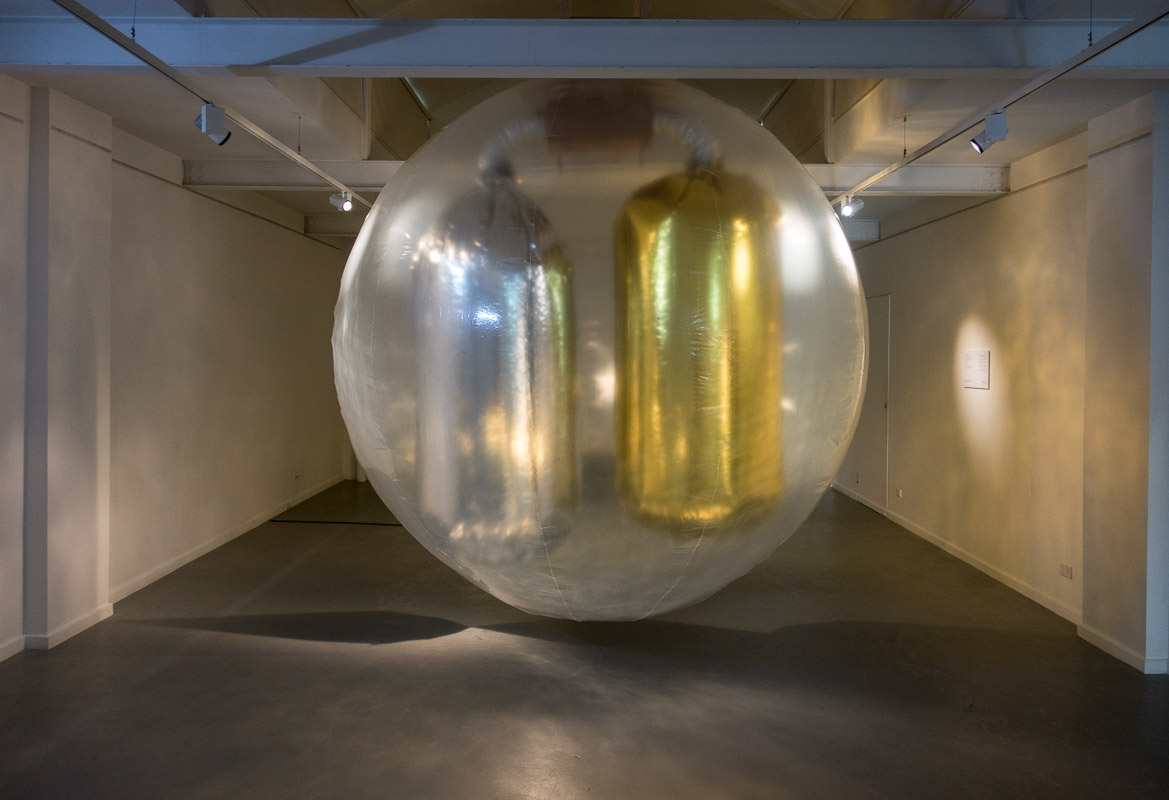
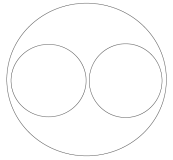
Life Support System proposes that the third model best describes the present-day world and represents the human, natural and economic systems in a 3-dimensional Venn diagram using three inflated vessels in the place of circles. Air is used as a driving force for the model as air — through the atmosphere — is shared by all these systems in the real world.
In each vessel the following behaviours are intended to suggest the operation of each system:
The two internal vessels represent nature and humanity and have a breathing action symbolising human breathing and the cycles of nature
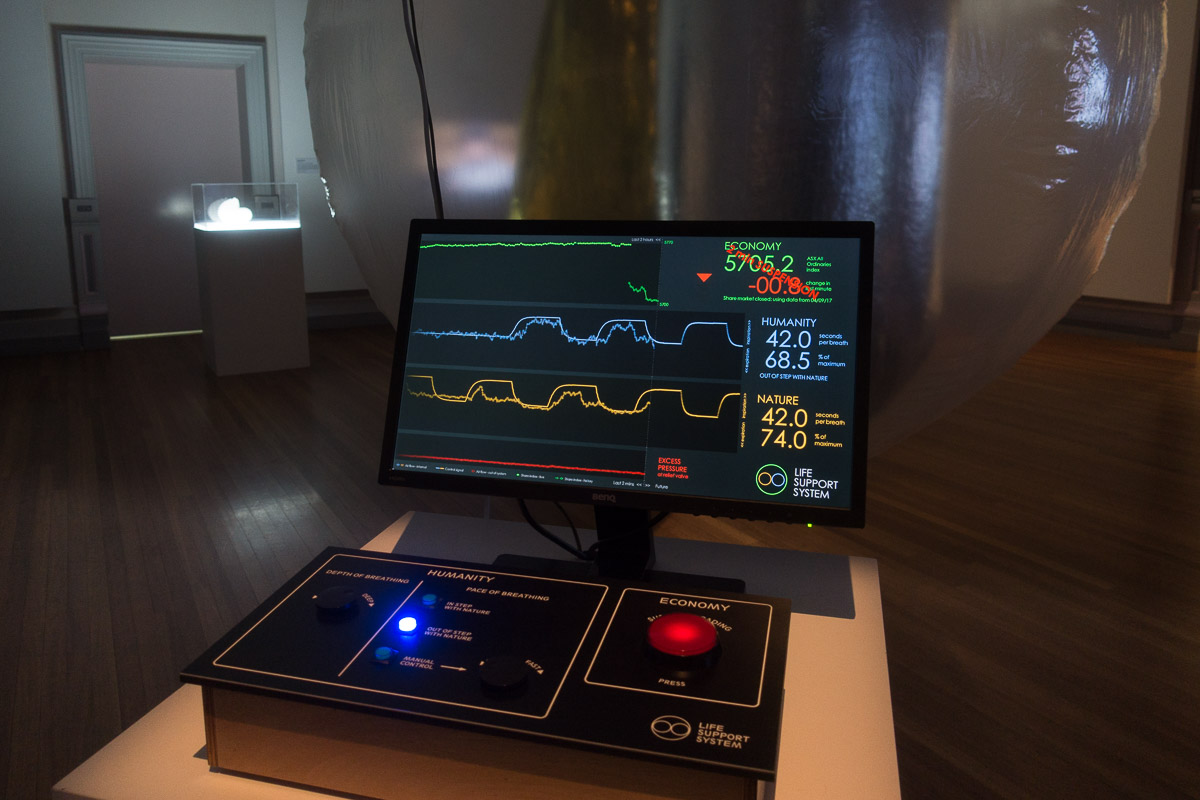
The external vessel is pressurised to a level determined by economic activity based on live share market trading data**
The monitor displays the operating parameters for each system and the air flows and pressure within the combined system.
The overall behaviour of the model is chaotic and unpredictable as the action of one system affects the behaviour of the other two, but it can be influenced by adjusting the controls on the operating panel.
** Share market prices are represented by live values of the All Ordinaries Index of the Australian stock exchange, updated each minute. At times when the ASX is not trading historic data from randomly selected trading days are used.
Exhibition and review history:
Jun 2024 – Gippsland Regional Gallery, Sale, Breathe exhibition
Feb 2022 – Canberra Contemporary Art Space, Carbon Neutral exhibition
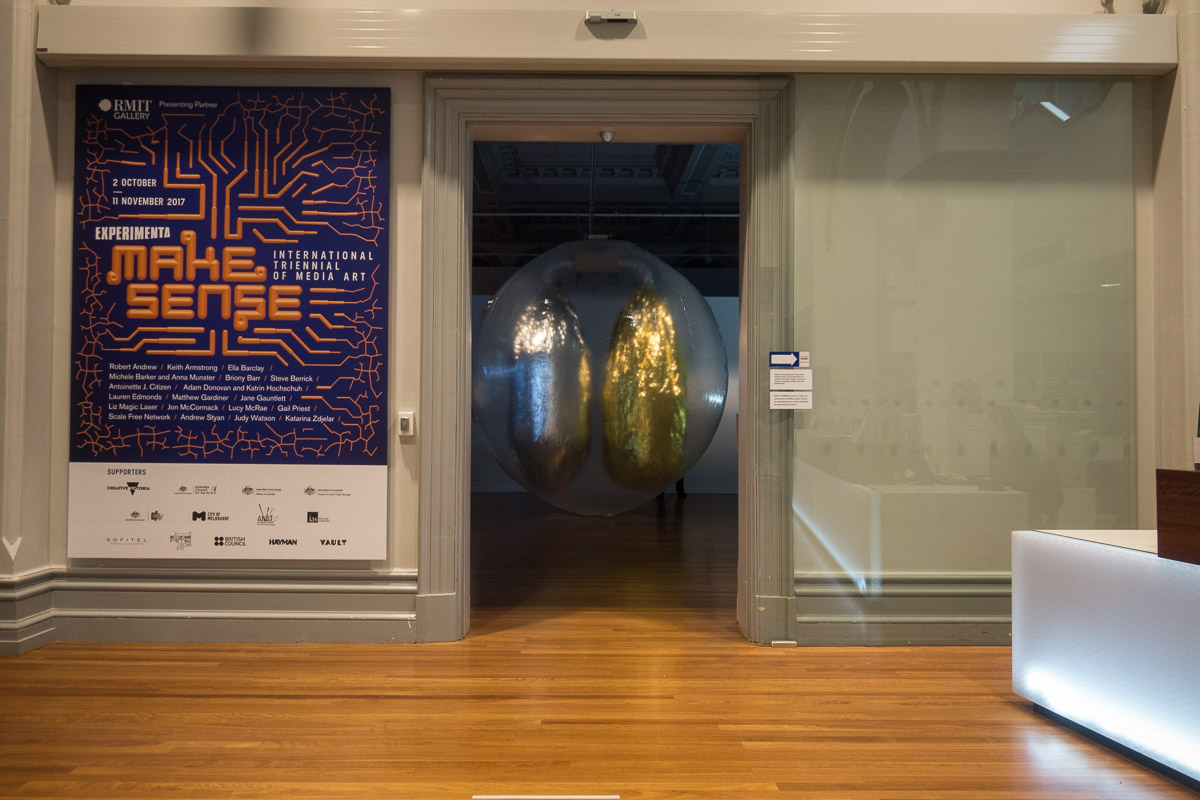
2017 to 2020 – Touring eastern Australia with Experimenta Make Sense International Triennial of Media Art
Sep 2018 – An image of the work used as the frontispiece for the book Australian Art Exhibitions: Opening our Eyes
Oct 2017 – Featured on the ABC television show The Mix as part of a review of the Experimenta Make Sense exhibition.
Oct 2017 – Experimenta Make Sense exhibition at RMIT Gallery, Melbourne
Jan 2017 – Reviewed by Jill Stowell of the Newcastle Herald.
Dec 2016 – First exhibited at the Every Breath exhibition at the Lock-Up gallery, Newcastle.
